
Mining Actionable Insights From Reporting
One of the biggest challenges many marketers face is turning data into actionable insights. There’s no shortage of digital marketing reporting platforms. And they run the gamut from free to costly, cumbersome to intuitive. Therefore, having a reporting tool with the right data and advanced filtering tools gives you the flexibility to understand the stories informing your marketing. But, selectively extracting the most pertinent data, using it to inform your daily activities, and strategic planning is where the sharpest marketers rise above the masses.
G5 Analytics is a comprehensive reporting platform that measures your marketing effectiveness. It connects the dots between, “what results am I seeing?” and, “what actions should I take?” Let’s take a closer look at some of the latest updates in G5 Analytics, explore how you can jumpstart your insight gathering, and learn to execute on those insights.
Invest a Little, Gain a Lot
Getting into a reporting rhythm can feel like a time commitment, but the reality is a little investment goes a long way. On average, G5 Analytics users spend 10 minutes per session. That’s minutes, not hours, needed to understand what’s working so they can be effective marketers. You can get started by determining which metrics support your overall KPIs and goals. Take a little time to find those metrics in G5 Analytics. Schedule time on your calendar each week or month for your reporting review and stick to your commitment. We promise it will pay off.
Pro tip: Determine which reports are most useful to your ongoing metrics and scan results for trends and highlights. Bookmark your filters to save them for later and sign up for the Monthly Lookback Report to have it delivered to your inbox each month.
Understand Your Sources
Giving credit to the right channels is critical when measuring impact and reporting to stakeholders. G5 labels each call tracking number to connect various marketing sources, giving you better insights. Through our partnership with Google, we’re now able to better track inquiries generated from GMB listings. Now you can not only track who has called directly from your GMB listing on the Search Engine Results Page (SERP), but who called after visiting your website from your listing.
When using the Inquiry Overview Report, look to the Top 10 Sources section to take a quick pulse on your calls and forms coming from GMB. Smart marketers know that GMB is THE avenue for driving local search and that increased visibility is key for connecting with local prospects. Create a summary of key takeaways from your GMB inquiries. Since the data proves your prospects are engaging, evaluate additional potential with this channel and craft a plan to improve results.
Ask the Right Questions
Learning how to ask the right questions from your reporting and making recommendations are essential skills every marketer should master. Narrow your research to trends, KPIs, and leading indicators to tie your efforts directly back to business impact, revenue, and company-wide goals. Not sure where to start? Read our blog, Analytics for Marketers: Goals, KPIs, and Metrics, to learn more.
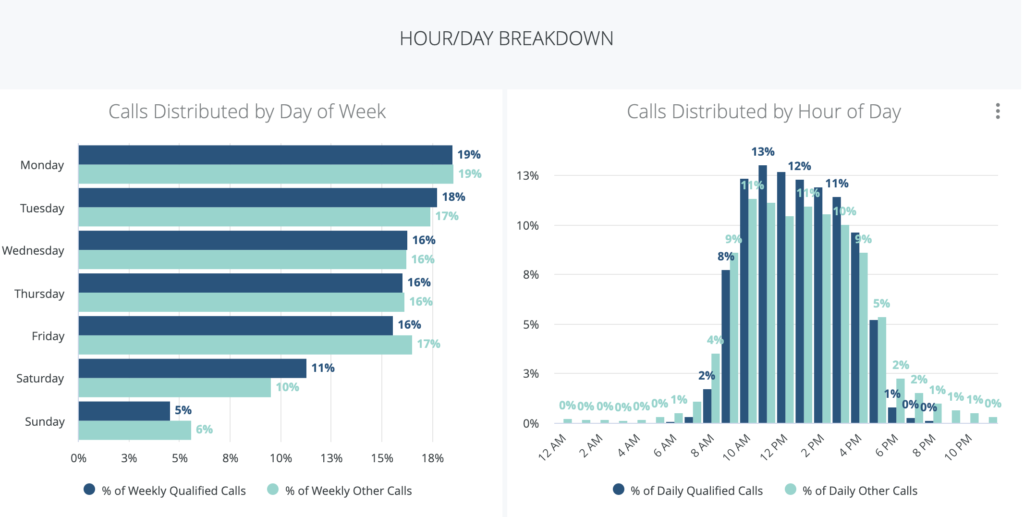
Property-specific time zone reporting is a prime example of how you can turn marketing insights into action. The Inquiry Overview dashboard has two new visualizations that display inquiries by the day of the week and hour of the day. Savvy marketers use this data to first verify when their peak inquiry times are, and to next ask some key questions:
- Is my property well-staffed during these peak hours?
- What is our typical response rate during these peak times? Does that align with market expectations?
- What recommendations can I make to improve our operations during these peak times?
Get Granular
Marketers are generally on top of their year-over-year and quarter-over-quarter reporting. While these traditional measurements still have merit, adding in a granular and short-term analysis lens is becoming equally important. Therefore, many reports now include a weekly dashboard and additional time filters to customize your queries and slice deeper into data sets. Utilize the Key Metrics Trending Report to be proactive instead of reactive with your reporting tactics.
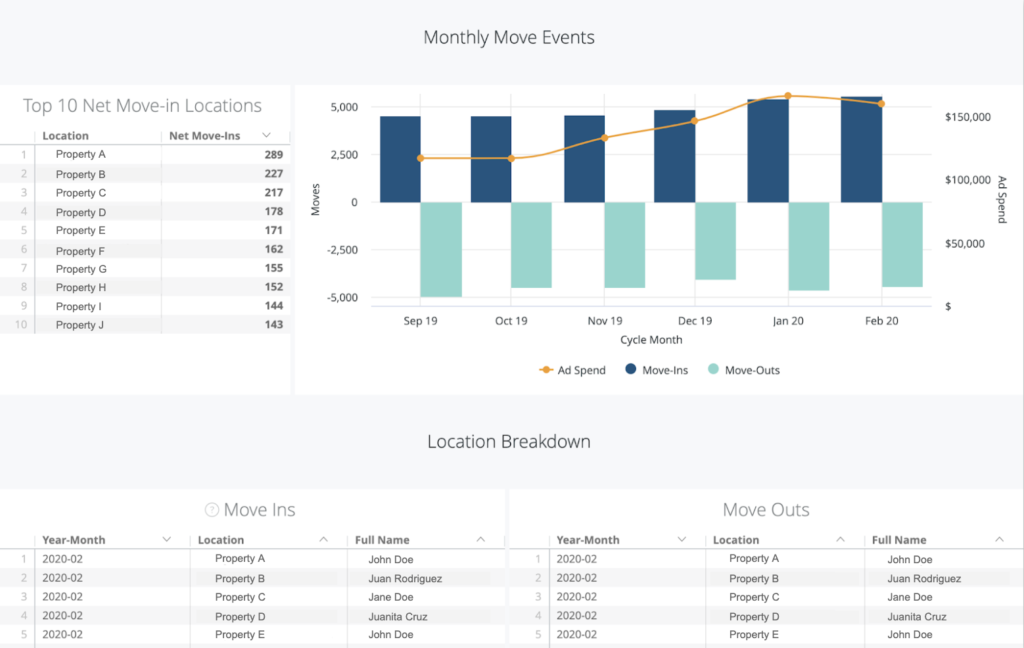
Additionally, by connecting lease pullbacks and analyzing the details of your move-ins and move-outs, you can use the new Move-Ins Report to track how marketing spend impacts the bottom-line. By overlaying advertising spend and property activity, you can see how changes in ad spend might impact move-ins in future months.
G5 understands that the list of urgent tasks vying for your time is endless and sometimes it’s hard to prioritize where to begin. Start simple by understanding marketing attribution and your renter’s journey. Then layer in additional analysis as your success metrics come into focus.
Ready to learn more? Schedule a demo of G5 Analytics or contact your G5 Account Manager to show you how to apply these reporting tips today.
Get News, Articles & Updates in Your Inbox
Thank You for Your Interest
We will be in contact soon and look forward to learning more about you and your company. Based on your marketing challenges, we’ll discuss increasing visibility into your analytics and how to generate more and better leads so you can achieve your marketing goals.
In the meantime, we invite you to check out our checklist on website accessibility. Use this checklist to start assessing the baseline accessibility of your website.
Enjoy! We’ll be in touch very soon.