
The Untold Story of Multifamily Leasing Season
The first rule in any business: know your customer. Understanding how and when renters search is essential to convert website traffic into leases. It allows marketers to align digital advertising spend to time periods where it will have the greatest impact on a renter’s journey. Multi-touch attribution allows us to understand a nuanced story of leasing season, and how it varies by geographic location and submarket. Let’s go!
Wait…What is Multi-Touch Attribution?
Watch Rosie Renter’s apartment finding journey and learn more about multi-touch attribution.
Simply put, multi-touch attribution takes into account multiple touchpoints in the buyer’s journey. It tracks the entire online journey from the first click to the last call. Multi-touch attribution conversions quantify which marketing channels led to the most form fills, phone calls, tours, or leases during a given time period.
Understanding the Customer Journey
A buyer’s journey like Rosie Renter’s can take time. In industries with lengthy consumer journeys, like multifamily housing, multi-touch attribution is critical to understanding how your prospects are connecting with your properties.
In 2019, renters averaged 21.9 days between their first online interaction to an inquiry. We also know 24% of renters engage with digital ads along their buying journey and 59% use organic search to re-find a property after their first web visit. Nearly two times as many renters search for an apartment on their phone versus on a computer, and they’re seeing fewer ads because of increased competition. Still, we know prospects click on ads, and the cost of ads is going up in response to greater competition. Thus, making your hyper-local SEO approach more important than ever.
Multifamily Leasing Season
Broadly speaking, summer remains the peak leasing season in multifamily housing. However, data from across more than 4,000 locations managed by G5 suggests that not all markets peak simultaneously – nor do they last the same length of time. A review of G5 customer data from November 2018 through October 2019 found that renter search and inquiry behavior varies by metropolitan statistical area and is dependent on economic drivers in the region, which means leasing season can change from year-to-year.
We analyzed Key Performance Indicators — or KPIs — across Houston, Seattle, and Phoenix. We choose these metropolitan statistical areas for their geographic diversity and high-volume of existing demand. Each KPI selected is critical as it highlights an aspect of the renter journey.
KPIs we’ll examine:
- Ad impressions – the number of times an ad appears.
- Ad clicks – the number of times someone clicks the ad and goes to a web page.
- Website sessions – the volume of traffic or visitors to a website.
- Multi-touch attribution conversions – the digital algorithm equivalent of a “how’d you hear about us?” questionnaire.
Ad Impressions
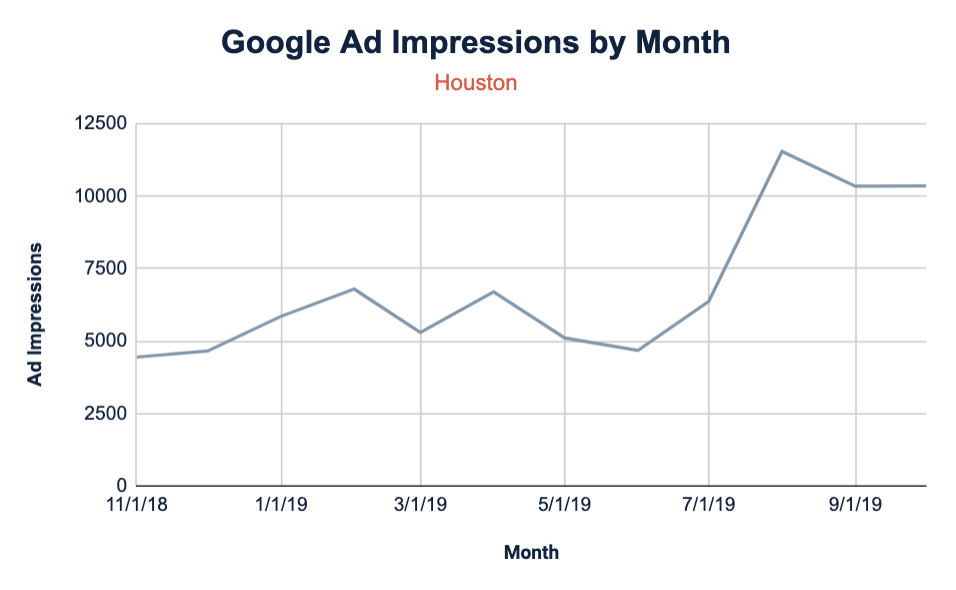
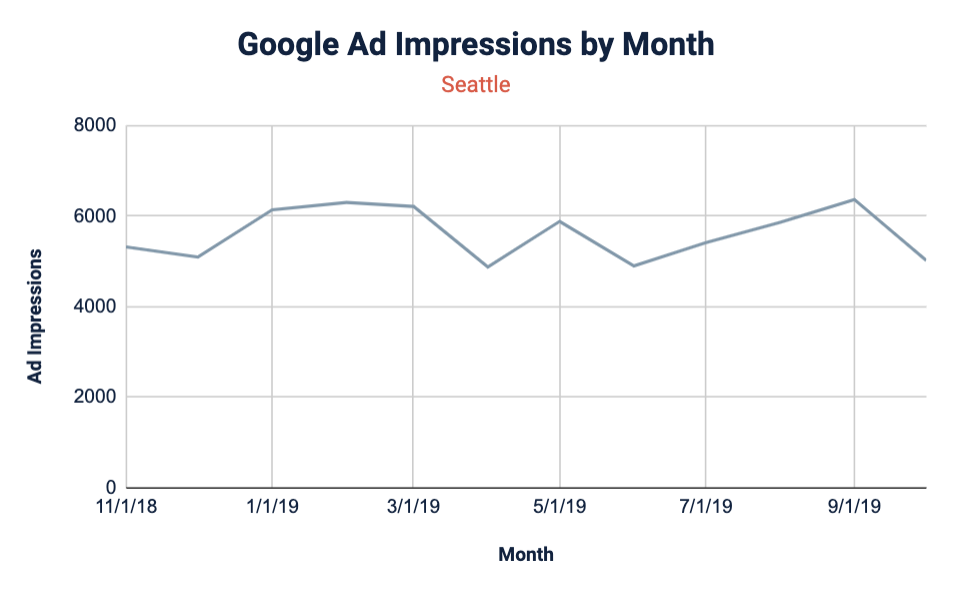
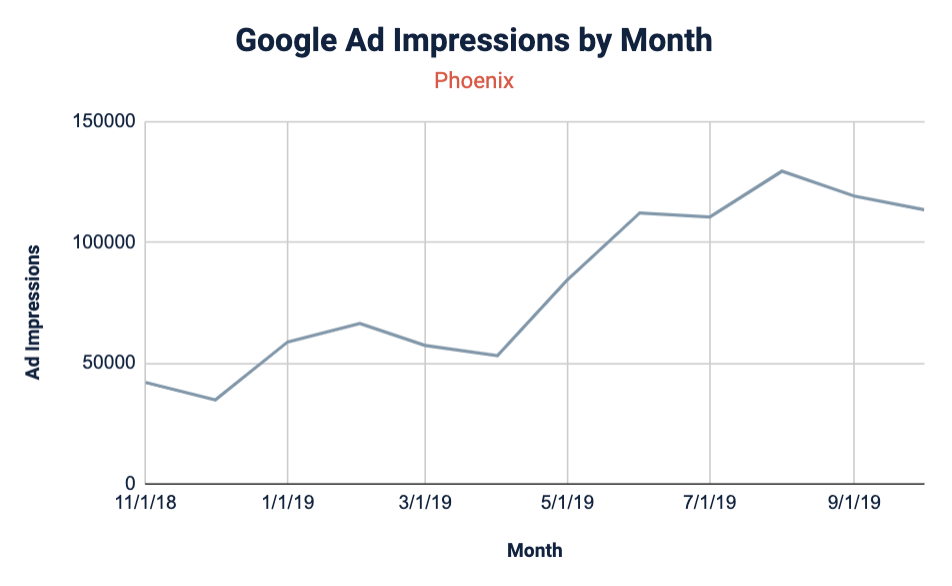
Ad impressions — or how often an ad appears on someone’s screen on the Google network for direct or contextually relevant searches — align to the awareness and discovery phases when renters are passively searching for an apartment. For all three MSAs, ad impressions were high during the traditional summer leasing season. Seattle’s ad impressions remain relatively steady throughout the year, indicating continued research. Whereas ad impressions in Houston and Phoenix dip in the winter months.
Ad Clicks
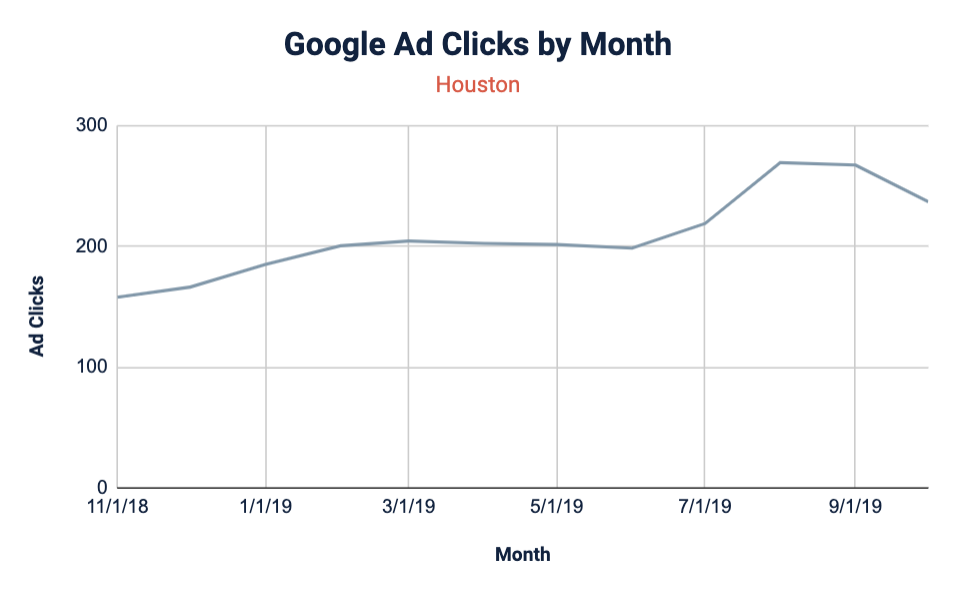
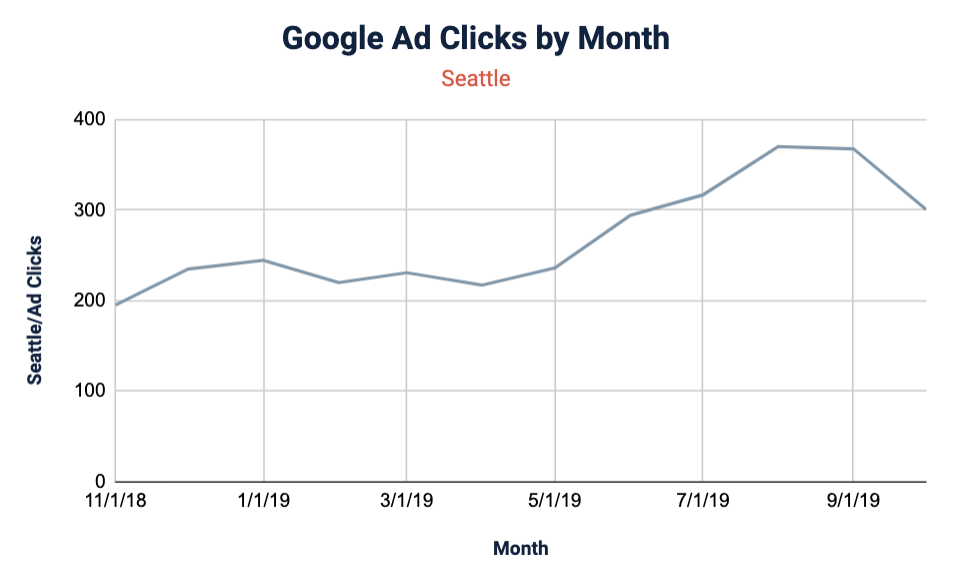
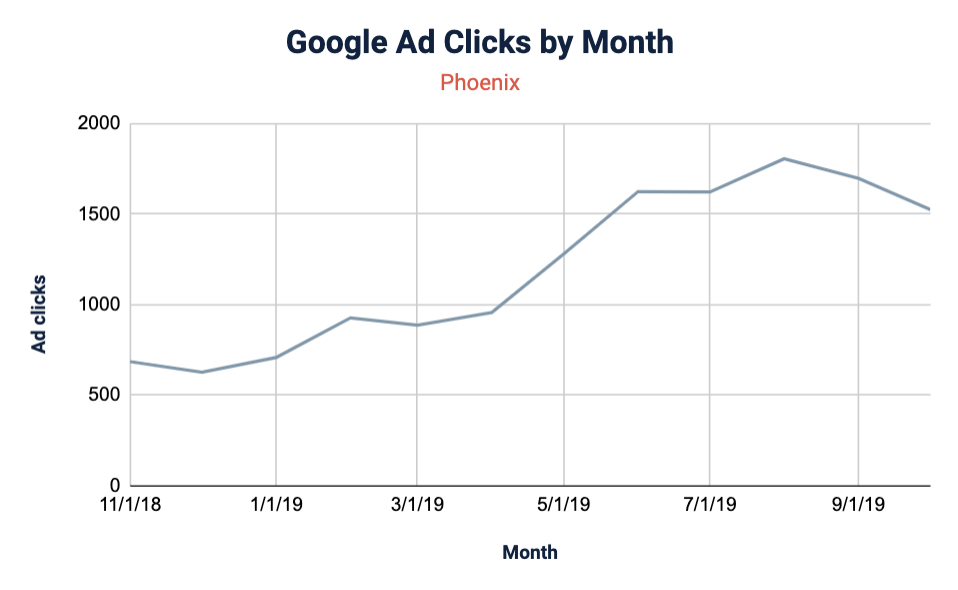
Ad clicks correlate to a more defined interest in an apartment home. This is often considered part of the education phase, when renters are actively researching. For all three cities, ad clicks increase during the summer months. Ad clicks in Houston remain high through the end of the year, meanwhile in Seattle and Phoenix clicks decrease in the winter months. Increased ad clicks correlates to heightened interest as renters continue their research.
Website Sessions
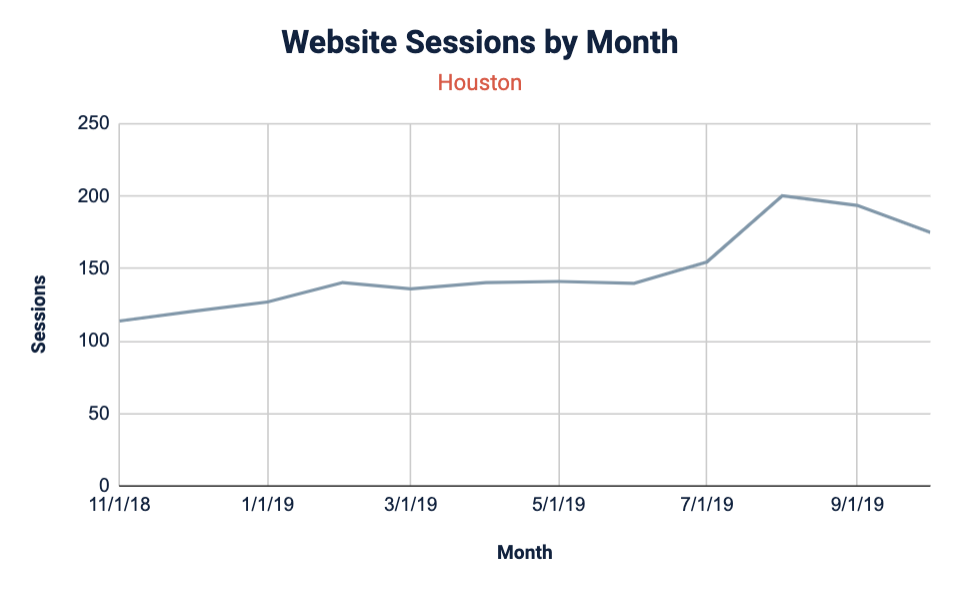
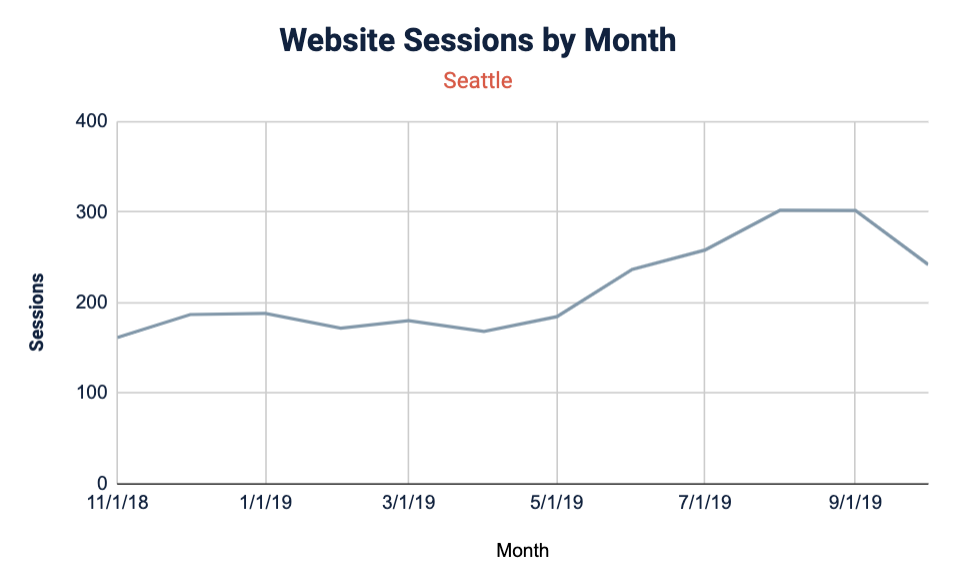
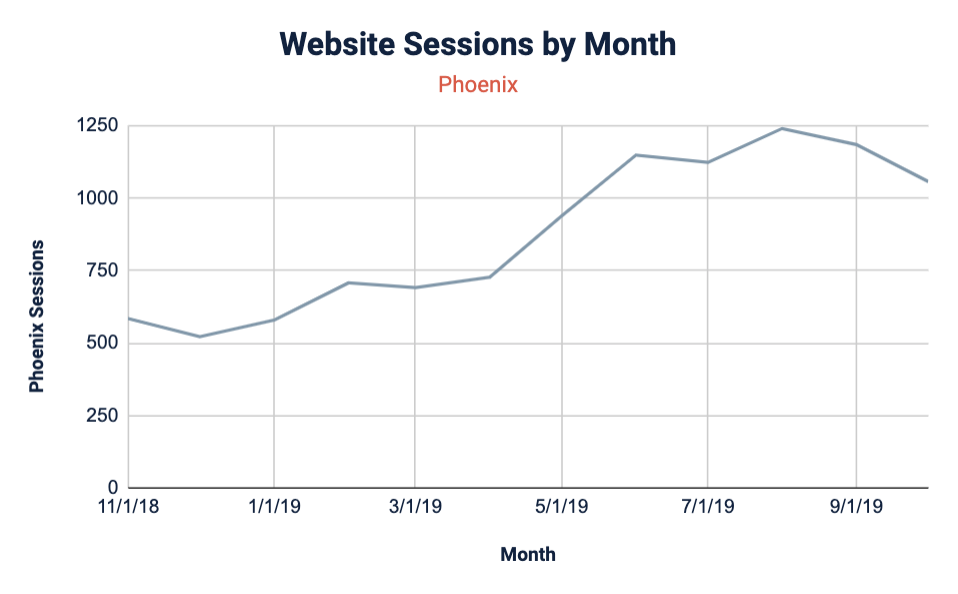
Website sessions occur during the research phase, but the traffic is better qualified, which signals an active interest. Naturally, website sessions trends follow ad click trends. As the audience becomes more interested in specific apartments, they devote more time to actively researching the property through their website. Houston breaks the trend: website sessions do not dip through the year indicating that renters are regularly researching their next home. Learn more about the details of each KPI in our State of the Industry report.
Why MTA Matters: Houston, Seattle, and Phoenix Leasing Seasons
When we only look at ad impressions and ad clicks in three distinct MTAs — Houston, Seattle and Phoenix — we of course see the traditional summer leasing season you’d expect. However, to only analyze traditional KPIs is a mistake, as each city’s leasing season is more nuanced.
We would miss a huge opportunity to connect with prospective renters when they are most engaged in their search. When we examine multi-touch attribution models in each city, we see unique patterns for each market. This shows renter behavior varies greatly by region.
Houston Leasing Season
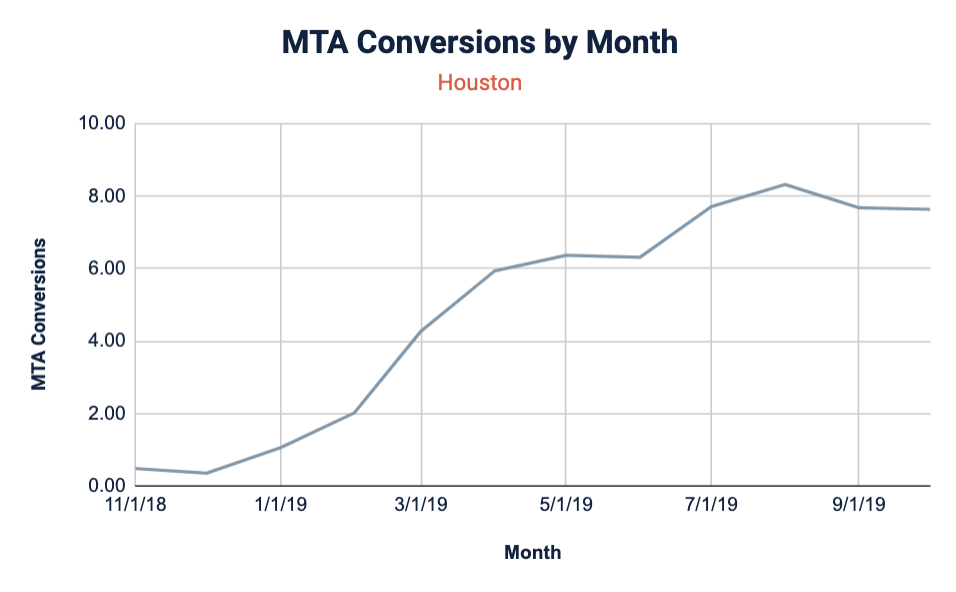
Houston has a relatively slow climb in conversion rates beginning in February, peaking in August and decreasing over the winter. This indicates renters begin their apartment search prior to giving notice and continuing through the longer leasing season.
Seattle Leasing Season
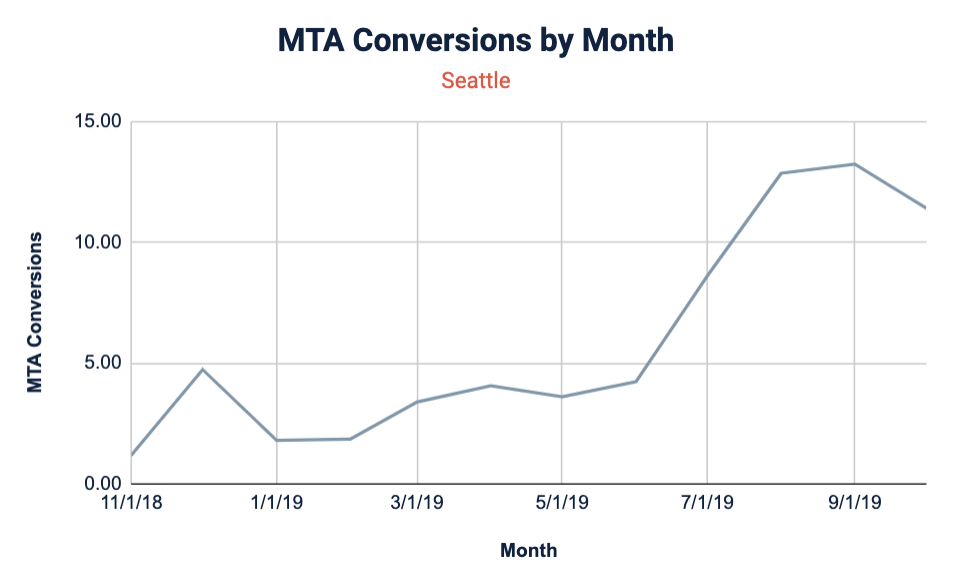
Seattle’s peak leasing season, August to September, is the shortest of the markets we analyzed. It coincides with the region’s best weather, warmest temperatures, and fewest rainy days. Renters begin their outreach to properties in August, during the peak leasing season. Unlike other markets, renters research consistently throughout the year with a rapid uptick beginning in June.
Phoenix Leasing Season
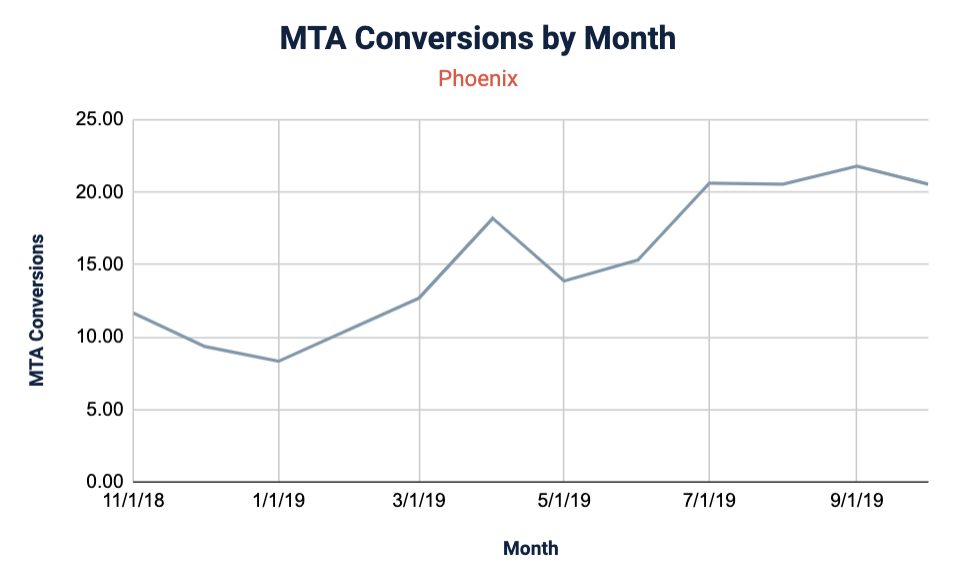
Compared with Seattle and Houston, Phoenix has an unusually long leasing season lasting from April to October. The first wave of renters enters the market during tax return season and the second, much larger wave, lasts from July through October. The high volume of ad impressions, clicks, and website sessions parallel employment growth and net migration gains for the area.
Each Market Matters
Multi-touch analysis gives us a deeper understanding of multifamily leasing season. Knowing how leasing seasons vary by market provides an opportunity to connect with prospective renters while they’re searching — and not when we think they are based on traditional metrics.
Learn more about multi-touch attribution conversions and the untold story of multifamily leasing season in Houston, Seattle, and Phoenix here.
Get News, Articles & Updates in Your Inbox
Thank You for Your Interest
We will be in contact soon and look forward to learning more about you and your company. Based on your marketing challenges, we’ll discuss increasing visibility into your analytics and how to generate more and better leads so you can achieve your marketing goals.
In the meantime, we invite you to check out our checklist on website accessibility. Use this checklist to start assessing the baseline accessibility of your website.
Enjoy! We’ll be in touch very soon.