
Senior Living Leasing Season Meets Multi-Touch Attribution
A business tip as old as time: know your customer. Senior living operators need to know seniors and their families. This means unpacking the data-driven ins and outs of when, where, and how they engage with your brand. Multi-touch attribution allows us to understand a nuanced story of leasing season, and how it varies by geographic location and submarket. Let’s dive in!
Wait, What is Multi-Touch Attribution?
Multi-touch attribution takes into account multiple touchpoints in the buyer’s journey. It tracks the entire online journey from the first click to the last call. MTA conversions quantify which marketing channels led to the most form fills, phone calls, tours, or leases during a given time.
Understanding the Customer Journey
It’s rare for a customer to go all-in after their very first online interaction with your community. Sometimes, they’ll see an ad, read a great online Google My Business review, browse your website, and eventually reach out for a tour. A buyer’s journey can take time. In 2019, seniors and their families averaged 16.7 days between their first online interaction to an inquiry. We also know 33% of senior living customers engage with digital ads along their buying journey. And, 39% use organic search to re-find a property after their first web visit.
All of this is to say that multi-touch attribution makes tracking effectiveness, optimizing spend, and understanding the customer journey in more detailed terms seamless.
Senior Living Leasing Season
There are three major seasons of senior living search: post-holiday planning, summer planning, and home-selling, and emergent holiday care needs. However, data from across hundreds of locations managed by G5 suggests that not all markets peak simultaneously – nor do they last the same length of time.
A review of G5 customer data from November 2018 through October 2019 found that senior search and inquiry behavior varies by metropolitan statistical area and is dependent on economic drivers in the region. Consequently, leasing season can change from year-to-year.
We analyzed Key Performance Indicators — or KPIs — across Chicago, Dallas, and Phoenix. We choose these metropolitan statistical areas for their geographic diversity and high-volume of existing demand. Each KPI selected is critical as it highlights an aspect of the resident journey.
KPIs we’ll examine for each MSA:
- Ad impressions – the number of times an ad appears.
- Ad clicks – the number of times someone clicks the ad and goes to a web page.
- Website sessions – the volume of traffic or visitors to a website.
- Multi-touch attribution conversions – the digital algorithm equivalent of a “how’d you hear about us?” questionnaire.
Ad Impressions
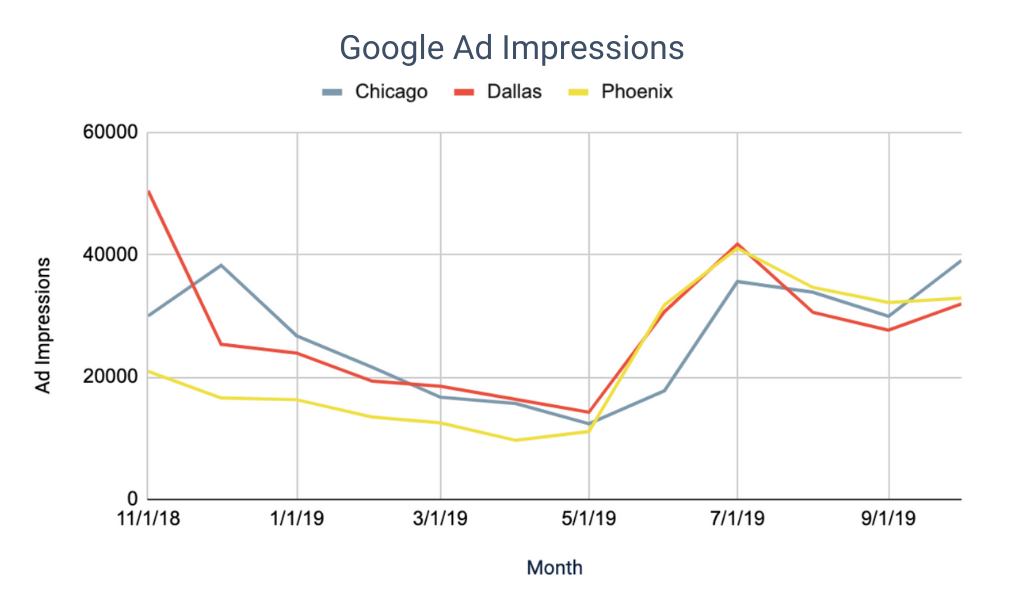
Ad impressions — or how often an ad appears on someone’s screen on the Google network for direct or contextually relevant searches — align to the awareness and discovery phases when seniors and families are passively searching for senior living. Across Chicago, Dallas, and Phoenix, ad impressions rose sharply, beginning in May and peaking in July. This indicates strong interest in senior living searches during the summer months, coinciding with seasonality leasing trends. Interestingly, active relevant searches continued into the late fall, slowing after the start of the new year.
Ad Clicks
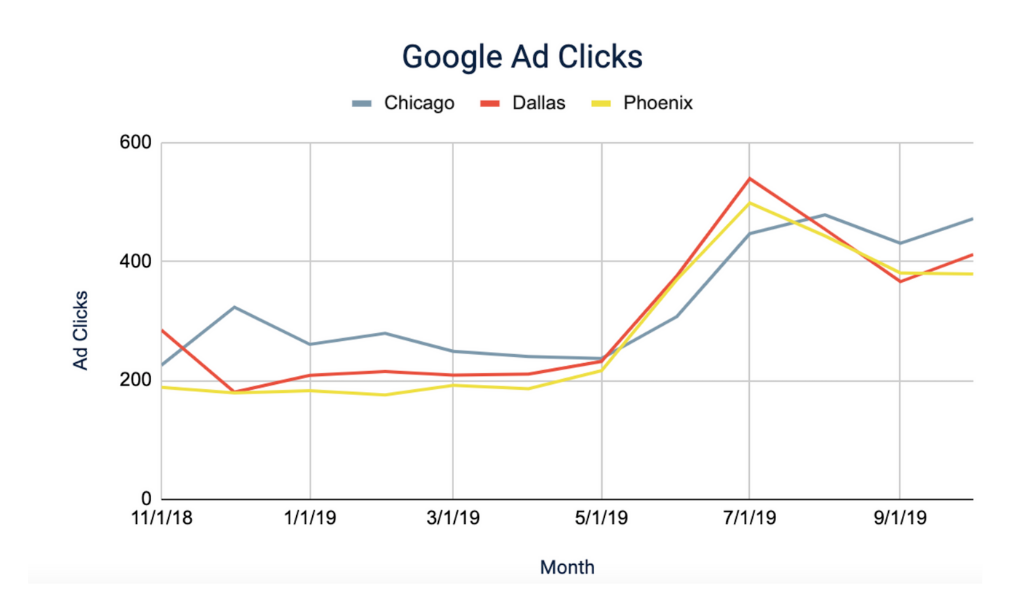
Ad clicks correlate to a more defined interest in a senior living community. This is often considered part of the education phase when prospects are actively researching. For all three MSAs, ad impressions were high through the end of the year and ad clicks were low and steady until May. This indicates that people were actively searching for senior living. But, they are not ready to take the next step to consider specific communities. Across all three markets, ad clicks increased rapidly in the summer months, peaking in July. This correlates to heightened interest as prospects dive deeper into their search.
Website Sessions
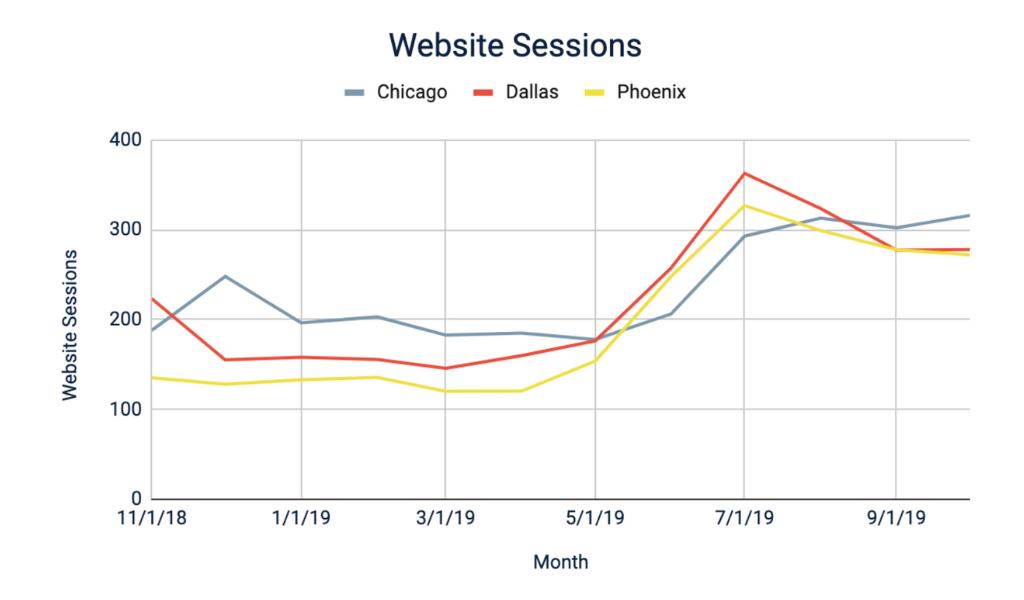
We know website sessions occur during the research phase, but the traffic is better qualified, which signals an active interest. Naturally, website sessions trends follow ad click trends. As the audience becomes more interested in certain communities, they devote more time to actively engaging with a community through their website.
Why MTA Matters: Chicago, Dallas, and Phoenix Leasing Seasons
When we only look at ad impressions and ad clicks in three distinct MTAs — Chicago, Dallas, and Phoenix — they follow the typical summer leasing season cycle. This could lead you to assume seniors and their families search in the same way and on similar timelines regardless of geographic location.
However, if this was the case, we would miss a huge opportunity to connect with prospective residents and their families when they are most engaged in their search. When we examine each city’s multi-touch attribution modeling, we see unique patterns for each market. This shows prospect behavior varies greatly by region.
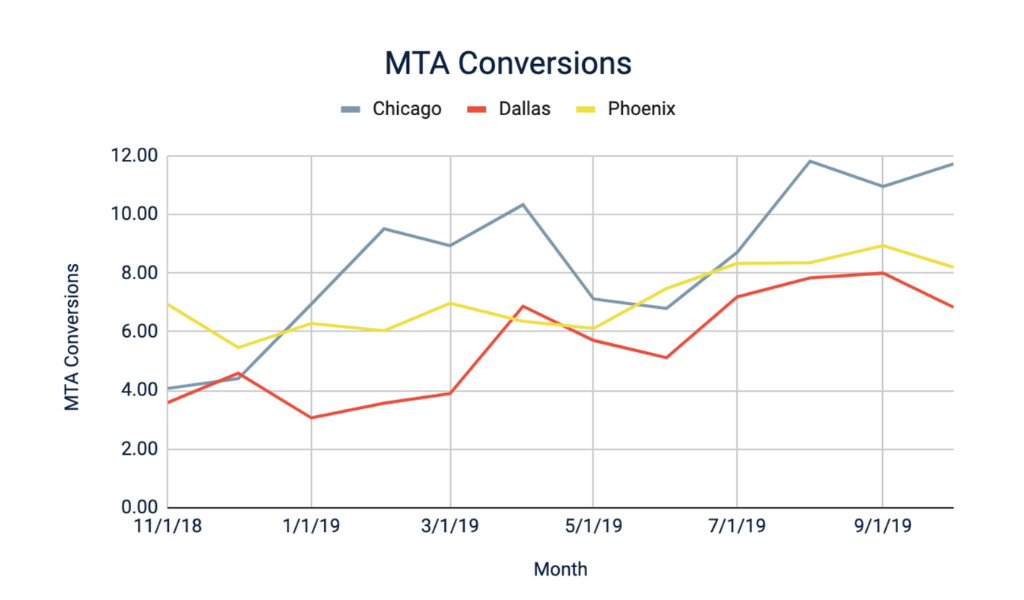
Chicago Leasing Season
We see three major peaks: late winter, early spring, and mid-summer. Cold seasonal weather may account for the late winter and early spring leasing season as many seniors and their families look for a lower maintenance living option.
Dallas Leasing Season
We see Dallas’s senior living leasing season picked up slightly around the holidays, with another uptick in April, coinciding with family gathering periods of Easter and Passover. However, the primary leasing season was July through September, coinciding with typical home-selling patterns in this market.
Phoenix Leasing Season
Phoenix had a consistent leasing season, with no major peaks or valleys. Prospects engage steadily throughout the year, with a slight uptick in engagement in early summer. This indicates that the Phoenix senior living leasing season is steady throughout the year and is likely due to net migration gains from other markets.
Each Market Matters
Multi-touch analysis gives us a deeper understanding of senior living leasing season. Knowing how leasing seasons vary by market provides an opportunity to connect with seniors and their families while they’re searching — and not when we think they are based on traditional metrics.
Learn more about multi-touch attribution conversions and the untold story of senior living leasing season in Chicago, Dallas, and Phoenix here.
Get News, Articles & Updates in Your Inbox
Thank You for Your Interest
We will be in contact soon and look forward to learning more about you and your company. Based on your marketing challenges, we’ll discuss increasing visibility into your analytics and how to generate more and better leads so you can achieve your marketing goals.
In the meantime, we invite you to check out our checklist on website accessibility. Use this checklist to start assessing the baseline accessibility of your website.
Enjoy! We’ll be in touch very soon.